AARRR Model
Amodel redefines digital marketing by focusing on measurable growth and customer retention.
Porter’s Five Forces
Analyze industry competition beyond direct rivals to uncover structural profit drivers.
Business Model Canvas
Visualize how your business creates, delivers, and captures value on a single page.
VRIO Framework
Evaluate whether your resources create real, defensible competitive advantage.
TAM-SAM-SOM Analysis
Enhance your market segmentation and marketing strategy
9 Key Forces of Mobile Technology Reshape Customer Behavior
Understand how context, location, and environment shape mobile customer decisions.
Ohmae’s 3C’s Model
Emphasizes the balanced integration of Company, Customer, and Competitor for strategic decisions, avoiding a singular focus.
TOWS Model
Turn SWOT insights into concrete strategic options and actions.
Outcome Discovery Canvas
Define measurable outcomes and success metrics before you commit to building features.
Product Lifecycle Model
Describe the natural path most products follow.
Value Stick Model
Helps businesses balance willingness to pay and willingness to sell
Product GTM Canvas
Brings clarity, reduces risk, and gives your product the best chance of success.
FASTR Framework
Filter AI use cases by risk, readiness, and measurable business value before committing real resources.
Philip Kotler's 5 Product Levels
Analyze where your product creates value and identify the layers where real differentiation happens.
CAGE Model
Provides a framework for comparing markets beyond surface-level metrics.
TAM-SAM-SOM Analysis: A Guide to Effective Market Segmentation
Enhance your market segmentation and marketing strategy
TAM-SAM-SOM Analysis
Introduction
Have you ever wondered how businesses identify the potential of a market and segment it effectively? The TAM-SAM-SOM model helps companies do just that.
Developed by marketing and business strategists, this framework allows organizations to better understand and measure the opportunity within a market.
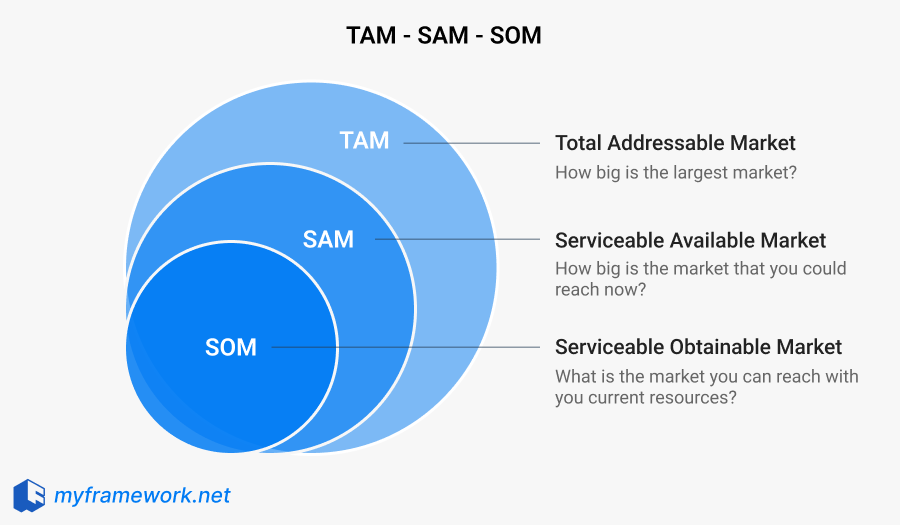
The model divides the market into three categories:
- Total Addressable Market (TAM)
- Serviceable Available Market (SAM)
- Serviceable Obtainable Market (SOM)
Each with a different level of market potential.
TAM (Total Addressable Market)
This is the broadest category and represents the total demand for a product or service within a market. It is the ideal scenario where a company has 100% market share and is serving every possible customer.
Key Questions for Defining TAM
What is the total size of the market globally or regionally?
What is the overall demand for this product or service?
How many potential customers exist, regardless of product availability?
What are the long-term trends driving the market’s growth?
SAM (Serviceable Available Market)
SAM is a more realistic view of the market. It narrows down the TAM to only those customers who are reachable based on geography, regulations, capabilities or resources.
Key Questions for Defining SAM:
Which geographic areas can I serve with my product or service?
What specific customer groups can I realistically target based on current capabilities?
What are the legal, regulatory, or cultural barriers preventing access to certain customers?
How does my offering meet the needs of this specific market?
SOM (Serviceable Obtainable Market)
SOM is the most specific category. It represents the portion of the SAM that your business can realistically capture, given your resources, competition, and market position.
Key Questions for Defining SOM:
What is the current competition in this segment, and what is their market share?
What portion of the market can I realistically reach in the next 6 to 12 months?
What resources (financial, human, or technological) do I have to capture this market?
How can I differentiate my offering to stand out in this specific segment?